

Bitcoin is currently trading in a narrow range, caught between the $113K resistance and the $110K support level. Bulls are struggling to regain momentum after recent pullbacks, while mounting selling pressure continues to weigh on short-term sentiment. The tight consolidation reflects investor indecision, with both sides waiting for a decisive breakout that could shape the market’s next major move.

Related Reading
Despite the near-term weakness, the long-term view remains more constructive. According to top analyst Darkfost, the 30-day average Coin Days Destroyed (CDD) remains elevated but has started to cool off. Notably, its value has already dropped by half from its previous peak, signaling a slowdown in old coin movements. This decline suggests that the heaviest phase of long-term holder distribution may be easing, providing the market with some breathing room.
If this cooling trend continues, it could reinforce Bitcoin’s long-term bullish outlook, even as short-term volatility persists. The combination of resilient support levels and declining long-term holder selling pressure may set the stage for a stronger recovery once external catalysts, such as Federal Reserve policy shifts, provide clarity.
Strong LTH Movement Meets Resilient Demand
Darkfost shared that the market has just experienced the strongest movement of old Bitcoin (LTHs) in this cycle so far. Long-term holders, who typically keep their coins dormant for extended periods, have been moving significant amounts of BTC back into circulation. This is a noteworthy development because it represents the most intense wave of long-term holder activity since the current bull cycle began.
What makes this event particularly striking is that despite the heavy selling pressure from these seasoned holders, Bitcoin’s price has only corrected between 10% and 13% from its recent highs. By historical standards, this is a relatively modest drawdown, suggesting that the market remains resilient.
Darkfost points out that the Coin Days Destroyed (CDD) metric is crucial here. CDD tracks how long BTC has been held before being moved. When older coins are suddenly spent, it typically reflects distribution by experienced holders—often interpreted as profit-taking or a shift in positioning. A spike in CDD, therefore, signals significant selling pressure.
However, the key takeaway is that demand has so far absorbed this spike remarkably well. Institutional inflows, treasury accumulation, and strong market liquidity appear to be offsetting the selling activity. While this doesn’t completely remove downside risk—especially if further long-term holders decide to exit—the market’s ability to withstand such a strong wave of distribution without a deeper crash is encouraging.
The broader implication is that Bitcoin’s structure remains strong, even as it faces temporary challenges. If demand continues to hold firm, this phase of redistribution may ultimately serve as a healthy reset, setting the stage for the next leg higher. Still, investors should remain cautious: the market is not out of the woods just yet.
Related Reading
Price Testing Support After Pullback
Bitcoin is currently trading around $112,870, staging a modest recovery after a pullback from its all-time high near $124,500. The chart shows that BTC has been in a consolidation phase following months of strong gains, with price action now hovering above the 100-day moving average (green line) and testing the mid-term trend structure.
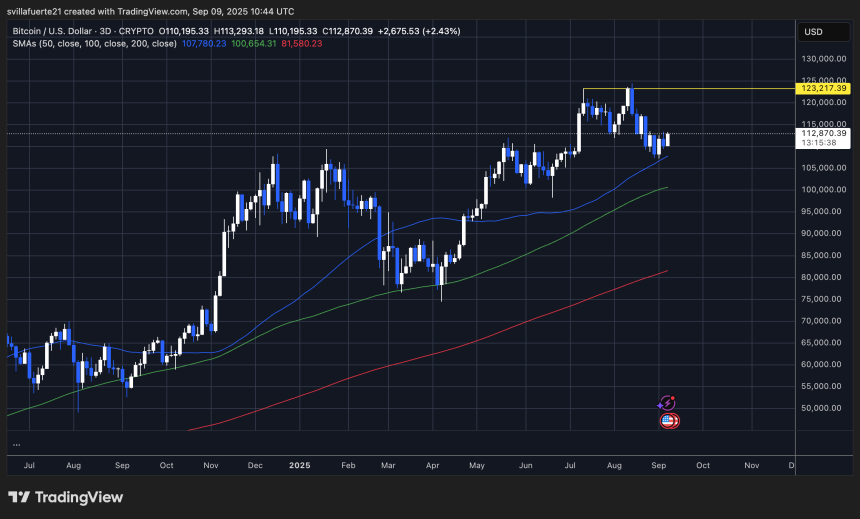
The 50-day moving average (blue line) is slightly above the current price, acting as short-term resistance. A decisive break above this level could open the door for another attempt at the $120K–$123K zone, which remains the critical resistance for bulls to reclaim in order to re-enter price discovery.
Related Reading
On the downside, support is forming around the $110K–$108K range, close to the rising 100-day moving average, which has held well during previous corrections. A breakdown below this level would risk a deeper retracement toward the 200-day moving average (red line) near $82K, though such a move would require strong selling pressure.
Featured image from Dall-E, chart from TradingView